For an Area or Line chart, you might want a marker that marks the whole X- or Y-axis and the data point. For visual reference, a line and dot marker will resemble the following image:
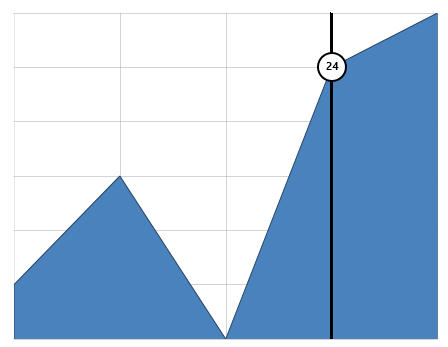
To create such a marker, one of the most important properties to set is the VerticalAlignment property. When you set this property to "Stretch", then the marker is stretched to the entire plot height, giving the vertical line. Here are the properties that you'll set in the markup:
- Attach = DataX
- Action = MouseMove
- DataPoint = -1, NaN
- HorizontalAlignment = Center
- VerticalContentAlignment = Stretch
Note that you're setting the Y part of the data point to NaN. You must do this in code, since WinRT will not allow you to set the data point to NaN in markup. This will also help to give full vertical line, since the marker will never attach itself to a specific data point. The circular label in the image above is another ChartPanelObject that will be positioned on the plot element. It's DataPoint property will be something other than NaN.
You can create this effect just using XAML markup and only one line of code:
| XAML |
Copy Code
|
|---|---|
<c1:C1Chart x:Name="c1Chart2" ChartType="Area" Palette="Office" Margin="20" Height="350" Width="450"> <c1:C1Chart.Data> <c1:ChartData> <c1:ChartData.Children> <c1:DataSeries Label="s1" Opacity="1" Values="20 22 19 24 25"/> </c1:ChartData.Children> </c1:ChartData> </c1:C1Chart.Data> <c1:C1Chart.View> <c1:ChartView> <!-- Markers layer --> <c1:ChartView.Layers> <c1:ChartPanel> <!-- vertical line and dot markers --> <c1:ChartPanelObject x:Name="line" Attach="DataX" Action="MouseMove" VerticalContentAlignment="Stretch" HorizontalAlignment="Center" > <Border Background="Black" BorderBrush="Black" Padding="1" BorderThickness="1 0 0 0" /> </c1:ChartPanelObject> <c1:ChartPanelObject x:Name="dot" Attach="DataX" Action="MouseMove" DataPoint="0.5,0.5" HorizontalAlignment="Center" VerticalAlignment="Center" > <Grid DataContext="{Binding ElementName=dot}"> <Ellipse Fill="White" Stroke="Black" StrokeThickness="2" Width="30" Height="30" /> <TextBlock Text="{Binding DataPoint.Y}" FontWeight="Bold" Foreground="Black" VerticalAlignment="Center" HorizontalAlignment="Center"/> </Grid> </c1:ChartPanelObject> </c1:ChartPanel> </c1:ChartView.Layers> </c1:ChartView> </c1:C1Chart.View> </c1:C1Chart> |
|
Here's the line of code you'll need to create this marker effect:
| C# |
Copy Code
|
|---|---|
((ChartPanel)c1Chart2.View.Layers[0]).Children[0].DataPoint = new Point(-1, double.NaN); |
|